Sylvan Lake can be a good indicator of the Central Alberta’s seasonal environment and weather history in both summer and winter. Let’s examine a set of temperature data from 1996, a typical year.
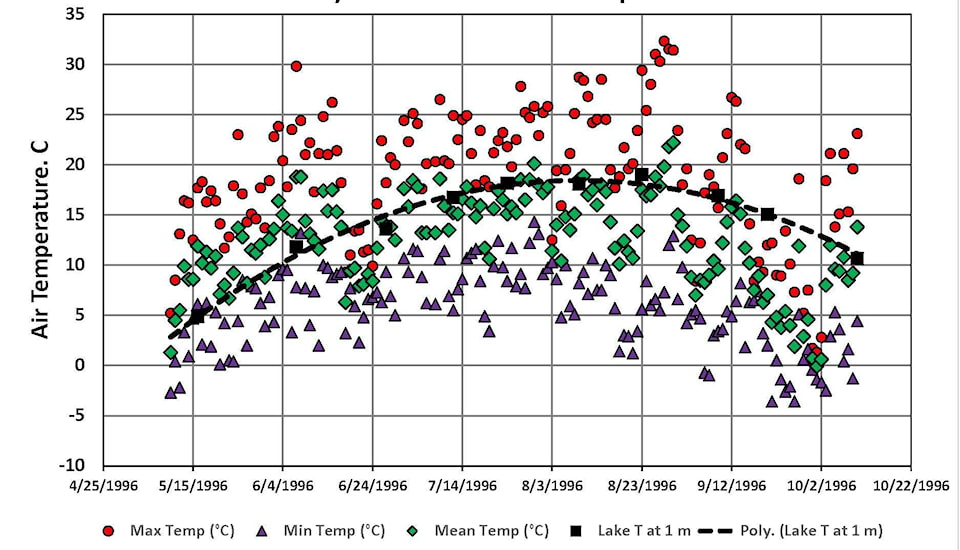
During water quality expeditions the main interest was in the vertical temperature (T) profile of the lake at its deepest point and not just in the top one metre layer used by swimmers. To reconstruct the 1996 history, we used water T data logged by Alberta Environment in 1996. See it in the master report on the watershed, ‘AXYS 2005’. We combined those water T values with air T data recorded at the Red Deer Airport and reported by Environment Canada for the same period. The graph below shows the air and lake values from that summer:
The thick black dashed line confirms that the top one metre of lake was only above a swimmable 15C between the end of June and mid-September. The lake surface could only heat up when the daily High air T (circles) was greater than the lake surface layer. The daily mean air Ts (diamonds) exceeded the lake T until early June, remained similar until late August, then quickly fell below the lake T value in September. None of that evidence is new to beachgoers who stop suntanning in September.
Daily Low Ts (the triangles) were always below the lake surface values and caused cooling which in turn enabled oxygen-rich surface water to displace the oxygen-depleted water at depth. That helped aquatic species survive through the winter months.
The T behavior of the air/lake system is controlled by the incoming solar radiation, the boundary layer air T, wind speed and humidity, and the T-dependent density of surface layer water which is at its maximum at about four degrees Celsius
What happens under Sylvan Lake ice in winter? The lake archives have the answer.
First, when the daily median air temperature is below that of the lake, the surface water cools, becomes denser, sinks, mixes, and gradually lowers the T of the whole water column. The concentration of dissolved oxygen is replenished at the bottom of the lake too. Water reaches a maximum density at four degrees C, so the deeper areas of the lake never freeze right to the bottom as some geothermal heat flows in. Eventually an ice layer forms on the lake surface and seals the surface of the lake from the atmosphere. The water column stabilizes as density and T gradients equilibrate.
Here’s what happened under the ice between 1984 and 2002: At one metre depth the recorded Ts were between zero and two degrees Celsius. At 10 metres the T was between about 1.2 and 3.3 C. Right at the bottom of the lake at the 16 metre depth, T was about 4C where water reaches its maximum density. At that point, both warmer or colder volumes of water were more buoyant and would rise, mix, exchange heat, and equilibrate at a new level in the water column. That density-driven mixing makes the lake a dynamic place.
Lots of heat transfers in and out of Sylvan Lake during the annual cycle. For example, to melt 0.5 metre of ice on the 42 million square metres of lake area would require 7-million Gigajoules (GJ) of energy. To warm up the 420-million cubic metres of lake water through a 15C range would require an additional 28 million GJ. So, the total energy input would be 35-million GJ. The cost of that thermal energy as natural gas at $1.5/GJ is about $53-million. The sun provides that heat for free.
For more background on Sylvan Lake, check out the Watershed Stewardship Society website https://slwss.org.